I’ve been wanting to announce this for a while, but between my poor quality code, poor quality documentation and getting it “greenlit” by $employer it has just been developed quietly in the background. There is still a long way to go, but the project has reached a state that i’m happy with..
Welcome Plunder..
The name is pretty terrible, but given the original purpose of this was to automate the deployment of Docker Swarm and Kubernetes on bare-metal I opted for something that at least had a nautical theme to it.
The main purpose for creating this was:
Simplify the tooling
Ease setting up the environment
Ease automation
Add an abstraction layer (API) to ease higher level tooling interaction with bare-metal
As with most open source projects the project stems from having to help people get things deployed on bare-metal platforms and thinking “How can things be this bad … still”. From challanges getting all of the constituent parts up and running to having to script various bits in a vain attempt to ease and automate it struck me how fragmented and terri-bad things still were.
I also looked at some of the new alternative newer tooling but issues in air-gapped environments to just how complex the initial set up was also put me off. Not to say that my attempt is much better, but the aim has always been to around making things quick and simple.
Projects
The plunder project has a number of sub-projects that all extend the functionality:
The plunder sub-project contains the API-driven deployment server that exposes all of the services required in order to deploy Operating Systems and platforms onto bare-metal servers.
pldrctl is the CLI that interacts with plunder over a network connection, allowing remote administrators to manage deployments on remote servers. The pldrctl tool also allows remote execution on newly deployed servers along with collecting logs of deployments.
The Cluster API provider implementation that allows a Kubernetes cluster to deploy additional (or guest) Kubernetes clusters on bare-metal. For details of using the cluster-api-plunder provider please follow the details here => https://plndr.io/cluster-api/
The cappctl tool is used to seed the first Kubernetes server in a brand new environment, it would typically be used to deploy the the master kubernetes cluster that the Cluster-api provider would then be deployed upon for all guest cluster deployments.
Future plans
There is no concrete roadmap for Plunder at this current point, mainly a list of goals as I attempt to mature the project.
Move the CLI pldrctl to having a release
Refactor the deployment engine plunder to improve logging output
Finalise the kickstart configuration in plunder
Extend functionality in the cluster-api-plunder provider
Grow the community…
Get involved
The blog that details the usage of plunder is available here => https://plndr.io
If you’re facing any problems then please raise issues or feel free to reach out to me on twitter
This is a bit of a retrospective based upon lessons learnt over the last few months as I’ve been working on a spare-time project to manage bare-metal provisioning. The hope of all of this was to make the experience more “cloud like”.
The retrospective
I will separate out a lot of the near misses that I’ve had during the development of a provisioning tool into a separate post, as I think some of the daft mistakes pretty much warrant something separate (apologies to the hotel in Germany, and a few corporate networks).
During a conversation with a colleague I was asked about my “takeaway” from the whole process, and my feedback … that it’s still as painful now due to the technologies not improving in nearly/over 20 years.
The current technologies
This was written at the later stages of 2019, and if Blade runner was anything to go by then we should be all be travelling in flying cars at this point. Sadly the cars don’t fly and DHCP/TFTP and PXE booting is still the order of the day when it comes to provisioning bare-metal servers. ¯\_(ツ)_/¯
So what are these technologies and what do they do?
DHCP - Defined in 1993, and it’s role is to give networking configuration to a device that requests it.
TFTP - A simple technology to transmit data (or files), usually used in conjunction with DHCP. Typically the DHCP configuration for provisioning will include configuration information that will point to a TFTP server and files for the machine to then download.
PXE - Originally standardised in 1998 this is a loadable environment that a server will execute in order to hand over to something that may load an OS or install something (such as an OS).
We can see pretty quickly that a lot of the tooling we still use today is pretty long in the tooth.
How does all this hang together?
Server powers on and the NIC (network card) will request DHCP config.
A DHCP Server will offer a DHCP lease (an IP address, DNS, gateway and perhaps other configuration information … such as a TFTP Boot path !)
The powered on server will examine the lease and usually decide to accept this lease, it will then inform the DHCP server that at’s accepted the lease offer. The DHCP server will then add the lease to it’s leasing tables so it won’t give that config to another server.
The powered on server will then apply the network configuration to the interface and it will also examine the DHCP Options and act upon those. In a provisioning environment there will DHCP options such as option 67! (Or the other name Bootfile-Name), this is typically a (tftp) path to a loadable PXE environment. This will be then fetched from the tftp server and executed at which point the PXE environment will start an OS or a deployment process.
Well that all seems straight forward.. what are you complaining about?
Under most circumstances most people don’t need to care about anything that DHCP does, go to a location add your iPhone to a network and magic you’re on the network streaming cat goose memes. (Which in the above example, only needs steps 1-3)
The problems start to arise when we look at steps 4 on onwards… especially when I want a “cloud-like-experience”
What is a cloud-like-experience?
Ideally, regardless of the environment I’d like to simply take my credit card out (or I’d rather not actually… but nothing tends to be free) click a button or two * some magic occurs * and ultimately I get some compute resource to use.
I shouldn’t have to care about:
What the physical servers hardware address is
The physical servers location
The physical servers favourite movie or music
Building configuration or configuration files to define the servers deployment
Deleting and the clearing of the deployment when I’ve finished (or my credit card is declined 😬)
Unfortunately that just isn’t the case today with bare-metal provisioning of lifecycle management. With the tooling that exists today at least.
You’re still complaining .. whats the problem today?
The (Big)MAC 🍔 is king
The physical servers hardware address is probably the most important thing that is required in order to provision a server. This address is called the MAC address and is a unique address that every network device has. This standard is part of IEEE 802.3 standards and the MAC address comes from work done in 1980/1982, making it older than me :-D
It is this MAC address that we use to define a physical server on a network, before it has any other defining characteristics such a an IP address. The problem that this creates is that we need to be aware of these hardware addresses before we can do any provisioning work (not very cloud like).
Configuration files … perhaps yaml isn’t so bad after all?
(Spoiler: yaml is still bad)
With a correctly configured DHCP server a newly powered on bare-metal machine will request a network address, where it will typically be given a lease and off we go… but wait … what if a server needs to be provisioned with a specific identity.
Under most circumstance a brand-new server once booted will be given a network address and nothing else, at which point the server will reboot as it has nothing else to do. So how do we get to the point where the server knows to install something?
(Spoiler: more configuration)
It is at this point where we need to create specific configuration files that tie the above MAC address to some level of configuration file. The PXE spec http://www.pix.net/software/pxeboot/archive/pxespec.pdf first documented in 1998 covers the basics for this, but for the best part the following will happen:
(step 4-ish) DHCP magic has occurred and a new bare-metal server has been given an IP address and a bootrom path to a PXE boot image.
(step 5) The PXE boot image will then attempt to download a configuration file that matches the MAC address of the server currently being booted. So for the server 00:01:02:03:04:05 the PXE boot image will attempt to pull a file from the tftp server will the name 01-00-01-02-03-04-05
(step 6) This configuration file contains all of the information (kernel, init ramdisk and other useful files and) the machine will then boot.
From this we can start to see that the MAC address (or unique identifier) of the physical machine first has to be known. Then we need to craft some artisanal PXE configuration that is specific for this server before it attempts to boot.
Further more, imagine larger environments of anything more than a few dozen servers.. suddenly we have a TFTP root directory filled with various PXE files that we’re “hand-crafting”.
Example
In the event server 00:11:AA:DD:FF:45 isn’t booting correctly…
This is more than likely because you keep making the wrong choice editing the following two files:
/tftpboot/00-11-44-dd-ff-45
/tftpboot/00-11-aa-dd-ff-45
I’ve managed to get my server deployed! .. hurrah .. now what?
I’m skipping over things like the Ubunutu/Debian preboot and the RedHat/CentOS kickstart as these are such large systems, yet so poorly documented that I’ll probably have to split them out.. BUT at this point our server should have an OS installed hurrah !
It’s at this point where we typically would need yet another system or set of automation tooling. This tooling would be required to perform another set of steps to provision things like applications or cluster platforms, or even just to finish customising the Operating System installation where the previously mentioned systems can’t automate.
I want to do something different with this server now
In a cloud environment, when we’re done with resource we typically will delete it.
However this operation doesn’t particularly lend itself well to bare-metal infrastructure. Typically as there isn’t really a full-proof or standardised way to automate the wiping and freeing of physical infrastructure that can be easily automated.
At the moment, the most full proof way of accomplishing this would be to log into the OOB management of a server and instruct the disk controller (RAID controller) to wipe the disks, and then reboot the servers leaving it back to it’s blank state. This is still a typically manual thing for the following reasons:
Every OOB system is different (APIs/CLIs etc.)
A lot of OOB require licenses
No standardised API (RedFish attempted it…)
Not every server even has OOB
So I understand all the steps I need to make this work, how do I automate it?
Cue “A-Team music” and a lot of cups of tea
Modernising Bare-Metal Deployments
Unfortunately it’s not as simple as plucking PXEv2 out of thin air :-( these technologies are “literally” burnt into the hardware and can’t simply be changed. So what can we do?
In order to modernise and make the existing tooling behave more cloud like we can consider the following additions:
Phase 1: Simplify the tooling
Currently before anything can even be provisioned various services need to be enabled (DHCP, TFTP, HTTP, PXE, Configuration files, etc…). All of these are separate installations and configurations.
To simplify this we can make use of modern languages to create a new single server that encompasses all of these functions.
Note: I know micro-services are new hot-ness, but given these technologies are so old they are unlikely to change anytime soon I think it might be relatively safe to bundle them as a monolith.
Bundling these services together into a single binary allows a single configuration to stretch between all three services allowing:
Single binary
Single configuration
Shared state between the services
Simple deployment
Auto-detect of the environment, simplifying the configuration design
This would allow us the capability of doing something like:
The above example will create a single configuration based upon the configuration of the deployment server and then start the needed services using that configuration. This vastly simplifies a lot of the required steps.
Phase 2: Enable via an API
To simplify provisioning we really need to wrap all of the management and configuration steps that were manual, with an API that will allow higher level systems and integrations to ease interaction and automation.
Create/Delete machine deployment using a MAC address and a deployment type
Additionally to make deployments more * Cloud-like * I don’t want to care about being aware of infrastructure before I want to consume it. To alleviate that we’ve can cobble together some functionality to “register” hardware and abstract it away to the end user.
When a server first starts we can register its MAC address as “free” and then either force the server to reboot until we need it, or we can power the server off and use something like WoL (Wake On LAN) when it’s time to provision. Doing this means that the end-user only needs to request resource, and if available our API can provision on available bare-metal.
With an API server it makes it a much better experience for other communities to build additional tooling and automation that can sit on top of a deployment engine and consume it’s functionality.
1 2 3 4 5 6 7 8 9
./voldemort start services --config ./config.json [00001] API Server listening on port 12345
# We can now have a separate CLI tool that can speak to the deployment engine over the network
./voldermortctl get deployments Deployment MAC Address Harry 00:11:22:33:44:55 192.168.0.100 Potter 11:22:33:44:55:66 192.168.0.101
Phase 3: Remove the need for lots of configuration files
We’ve simplified the deployment of the various services at this point, we can interact with these services and configuration with an API. What’s next…
As mentioned above, currently the main method for bare-metal deployments (following PXE standards) typically involves creating a file for EACH piece of physical hardware we want to provision that matches the hardware MAC address. This is error prone, hard to update, easy to break and over time will result in a build up of old configs.
To make life easier, move quicker and ensure consistency we can hold these configurations in memory. This allows us to not care about things like underlying filesystems, old persisting configuration etc… and have a single “source of truth” of configuration.
The benefits by moving to in-memory configurations removes a lot of additional tasks and greatly simplifies the management of configurations. We can now hold the configurations as data in-memory and point URLs of TFTP paths to these blocks of data. If a new configuration is created or updates then this block of in-memory data is modified, and the request to access it via URL/TFTP will just point to the updated block of data. If a deployment is deleted then we either delete the block of data or point the deployment to something else.
Phase 4: Additional things to make the end-users life easier
The above three phases have wrapped a lot of the older technologies with modern functionality to greatly ease deployment, automation and management… there are still a lot of other areas that can also make things easier.
Below are a few additions that when added should make things easier for end-users.
Templating of preseed/kickstart
All of the above technology/architecture options will provide a much better platform for being in a position to begin the provisioning. However the technologies that will automate the deployment of an Operating System are usually tied very closely to that particular OS. In my experience at least from a Linux perspective these tend to be preseed for Ubuntu/Debian and kickstart for CentOS and RedHat. Both suffer from slightly complex documentation and a myriad of out of date results on the internets that can be confusing
We can alleviate a lot of these issues by templating a lot of the standard OS deployment options and presenting a cleaner and simplified set of deployment options, allowing the end user to go FULL deployment if wanted.
The majority of Linux Distributions will release their Operating Systems in the form of ISOs (CD-ROM/DVD images) … when was the last time anyone say a DVD drive?
Regardless, In order to read the contents of the installation media elevated privileges are required to mount the content. We can simplify this by having our deployment engine read content directly from the ISO.
By doing something like the above we can link our templated deployments to the contents of Operating System images.
Higher level abstractions
Finally we have a fully automated platform that can be configured through an API, automatically provision on available hardware. We can now start to build on top of that..
Terraform A provider could easily leverage these apis to find available hardware and automate the provisioning of bare metal using the terraform DSL
Kubernetes Through the use of Cluster-API, we can extend Kubernetes with the logic of machines and clusters. Extending that further to interact with the API server would allow Kubernetes to deploy new or extend existing clusters.
Alternative deployment architectures
For a long time the most common way to provision or deploy a new operating system was to make use of technologies such as preseed or kickstart. These technologies will step through scripted installers and install every package that is a dependancy. Whilst this is a true and tested technology it is a mutable method and errors can creep in, network delays/failures or bugs in installation scripts can at points lead to failed installs… however there are alternatives.
Image deployments
There has been a growing trend in the infrastructure space to focus on using a prebuilt image as the method for deployment. This technology can find its roots in technologies such as Norton Ghost and probably in other tooling prior. However the methodology is relatively straight forward, in that a “golden image” is created and hopefully through an automated process. Then that image is written to the bare-metal server during provisioning. This ensures that the installations are always identical and skips any additional steps such as installation scripts or other unknowns.
Another alternative is that the deployment server will provide a kernel to boot over the network and also the path to an NFS share where the root file system lives (exported over an NFS share). Typically this involves a standard kernel and an initram disk that has NFS client utils present. Then as part of the deployment configuration, we present the bare-metal server with the kernel and Ramdisk and finally a additional flags that tell the Ramdisk to mount the NFS share and use it as a root disk.
A final option could be to utilise an iSCSI share and snapshots, where we’d create a master iSCSI LUN. We could then utilise snapshots to allow client to boot up utilising the underlying master LUN and keeping any of their changes in the snapshot that we’ve created for them. This can be achieved through the functionality that PXE boot loaders like iPXE currently support.
Conclusion
This conclusion is relatively short, but hopefully covers the points this post has been trying to make. The technologies and tooling that we have today is old, however it is for the best part stable and lends itself well to higher abstractions that can seek to modernised bare metal deployments. This will allow us for the time being to build systems on top that can ease automation and link bare metal deployments into new platforms.
My hope is that we get to a point where hardware vendors can agree to work on something new, something with automation and an API at it’s core. Also something that is open, because there are some technologies that can help today but not without a specific license for a specific vendor.
Voldemort ?
Currently nearly everything that is discussed in this post already exists (to a degree even the mocked up cli commands). However as this project currently isn’t really public I’ve not used it’s name …
hence: “The deployment engine who must not be named”
Before you can begin to create a Cluster-API provider there are a few tools and utilities that have to be in place to allow you to make your own provider.
GOLANG
At this time kubebuilder and the resulting examples all produce code in GO, so it makes sense to follow that path.
kubebuilder
The kubebuilder tool is used to handle the management and creation of CRDs (Custom resource definitions) and the controllers that manipulate the objects created from a resource definition. The installation information can be found here https://book.kubebuilder.io/quick-start.html. We will use kubebuilder in order to build our Machine, Cluster and Bootstrap CRDs and Controllers.
Cluster-API
Cluster-API is an upstream Kubernetes project that allows the extending of Kubernetes so that it can manage infrastructure resources and Kubernetes clusters much in the same way that it would manage the components of an application hosted on Kubernetes.
It can be installed by applying the manifest kubectl create -f https://github.com/kubernetes-sigs/cluster-api/releases/download/v0.2.6/cluster-api-components.yaml (correct as of 28th Oct’ 2019). This manifest will install the following:
CRDs for Machines, Clusters, MachineSets, MachineDeployments and Bootstraps
Controllers to handle all of the above resources
ClusterRole Bindings that will allow the above controllers to manipulate other controllers that are extensions of Cluster-API. (important)
If we examine this ClusterRole we can see what it is allowed to work on:
*.bootstrap.cluster.x-k8s.io [] [] [create delete get list patch update watch] clusters.cluster.x-k8s.io/status [] [] [create delete get list patch update watch] clusters.cluster.x-k8s.io [] [] [create delete get list patch update watch] machinedeployments.cluster.x-k8s.io/status [] [] [create delete get list patch update watch] machinedeployments.cluster.x-k8s.io [] [] [create delete get list patch update watch] machines.cluster.x-k8s.io/status [] [] [create delete get list patch update watch] machines.cluster.x-k8s.io [] [] [create delete get list patch update watch] machinesets.cluster.x-k8s.io/status [] [] [create delete get list patch update watch] machinesets.cluster.x-k8s.io [] [] [create delete get list patch update watch] *.infrastructure.cluster.x-k8s.io [] [] [create delete get list patch update watch]
The final line details that we will have access to the resource *.infrastructure.cluster.x-k8s.io (with an asterisk), this resource is blanket statement for the other Cluster-API providers and will be covered a little bit more when we create a provider with kubebuilder.
Building
To build a Cluster-API provider we can make use of the model that exists within kubebuilder and extend it so that it’s both aware of Cluster-API and so that Cluster-API can drive the provider.
Initialise the repository
We will need a workspace in order to create our Cluster-API provider, so we will create our directory mkdir cluster-api-{x}; cd cluster-api-{x}. If this is outside of the $GOPATH, we can examine this by looking at go env then we will need to create a go.mod which we can do with go mod init {x}.
Create the CAP{x} project
Once our directory is created and we’ve initialised our go environment, we will use kubebuilder to define the initial project.
Important: If we look at the domain, we need to specify that it needs to be the same domain that is specified above as part of the clusterRole bindings for capi.
kubebuilder init --domain cluster.x-k8s.io --license apache2 --owner "The Kubernetes Authors"
Creating CRDs/Controllers with kubebuilder
With everything ready we can now define our Custom Resource Definitions and the Controllers that will manipulate them.
If we break down the command flags:
--kind The type of resource we are defining (needs a capital letter to define it)
--group The group these resources will live under
--resource Create the CRD
--controller Create the Controller code
--version The version of our CRD/Controller we’re defining
If we were creating a Cluster-API Provider called example then the command would look something like :
Which would create our resource => exampleCluster.infrastructure.cluster.x-k8s.io, which we can see looking back at the clusterRole bindings allows capi to manipulate it.
Add clusterv1 "sigs.k8s.io/cluster-api/api/v1alpha2" to import(s)
Add _ = clusterv1.AddToScheme(scheme) to init()
API Definitions in /api/v1alpha1
{x}cluster_types.go
Add Finalizer to {x}cluster_types.go
1 2 3 4 5
const ( // ClusterFinalizer allows {x}ClusterReconciler to clean up resources associated with {x}Cluster before // removing it from the apiserver. ClusterFinalizer = "{x}cluster.infrastructure.cluster.x-k8s.io" )
Add additional fields to Status
1
2
3
4
5
6
7
8
9
// Ready denotes that the docker cluster (infrastructure) is ready. Ready bool `json:"ready"`
// INSERT ADDITIONAL STATUS FIELD - define observed state of cluster // Important: Run "make" to regenerate code after modifying this file
// APIEndpoints represents the endpoints to communicate with the control plane. // +optional APIEndpoints []APIEndpoint `json:"apiEndpoints,omitempty"`
Cluster specific endpoints
1 2 3 4 5 6 7 8
// APIEndpoint represents a reachable Kubernetes API endpoint. type APIEndpoint struct { // Host is the hostname on which the API server is serving. Host string `json:"host"`
// Port is the port on which the API server is serving. Port int `json:"port"` }
Change infrastructurev1alpha1 <import path> to infrav1 <import path>, this will make the code easier to re-use in the future and to share code with other Infrastructure providers.
// Create an empty instance of a {x} Cluster object {x}ClusterObj := &infrav1.{x}Cluster{} // Fetch the out Cluster object if err := r.Client.Get(ctx, req.NamespacedName, {x}ClusterObj); err != nil { if apierrors.IsNotFound(err) { return ctrl.Result{}, nil } return ctrl.Result{}, err }
Modify the Reconcile function (part 2: Find the Cluster-API cluster)
1 2 3 4 5 6 7 8 9 10 11 12 13
// Fetch the Cluster API Parent. cluster, err := util.GetOwnerCluster(ctx, r.Client, {x}ClusterObj.ObjectMeta) if err != nil { return ctrl.Result{}, err }
if cluster == nil { log.Info("Waiting for Cluster Controller to set OwnerRef on {x} Cluster") return ctrl.Result{}, nil }
// Enable Logging to refence the Cluster-API cluster log = log.WithValues("cluster", cluster.Name)
Modify the Reconcile function (part 3: Create a defer to patch the object)
1 2 3 4 5 6 7 8 9 10 11 12 13 14 15
// Initialize the patch helper patchHelper, err := patch.NewHelper({x}ClusterObj, r) if err != nil { return ctrl.Result{}, err }
// Always attempt to Patch the {x}Cluster object and status after each reconciliation. defer func() { if err := patchHelper.Patch(ctx, {x}ClusterObj); err != nil { log.Error(err, "failed to patch {x}Cluster Object") if rerr == nil { rerr = err } } }()
Modify the Reconcile function (part 4: Act on the {x} cluster object)
func (r *{x}ClusterReconciler) reconcileCluster(logger logr.Logger, cluster *clusterv1.Cluster, {x}Cluster *infrav1.{x}Cluster) (_ ctrl.Result, reterr error) { logger.Info("Reconciling Cluster") if !util.Contains({x}Cluster.Finalizers, infrav1.ClusterFinalizer) { {x}Cluster.Finalizers = append({x}Cluster.Finalizers, infrav1.ClusterFinalizer) } // RECONCILE LOGIC // IMPORTANT - Setting this status to true means that it is recognized as provisioned / ready {x}Cluster.Status.Ready = true return ctrl.Result{}, reterr }
func (r *{x}ClusterReconciler) reconcileClusterDelete(logger logr.Logger, {x}Cluster *infrav1.{x}Cluster) (_ ctrl.Result, reterr error) { logger.Info("Deleting Cluster") // DELETE LOGIC // Filter out this cluster from the list of finalizers (remove the object from Kubernetes) {x}Cluster.Finalizers = util.Filter({x}Cluster.Finalizers, infrav1.ClusterFinalizer)
As part of a shared coding demo I’m hoping to deliver in the near future I decided to document some of the tooling that seems to work pretty well for me and how I’m using it!
ttyd
The ttyd tool allows for sharing a terminal session over a web browser, and works fantastically! The github repository for ttyd is https://github.com/tsl0922/ttyd.
Installation
Grab the binary releases from the release page and de-compress the archive
Move the binary to a path it can be ran from and ensure it is named ttyd
Usage
The usage of ttyd is well explained on the github page, however for quick usage it’s typically ttyd -p <port num> [cmd]. Any user can now connect to the IP address where ttyd is running (on the specified port) and they will instantly access the program specified at the end of the command [cmd].
Shared session with ttyd
One of the requirements of what I want to do is to have all users share the same session, and for that session to be read-only. Luckily we can easily do this with an additional utility called screen.
Create a shared screen session
The first thing we need to do is to create our shared screen session and give it a name, which we can do with the following command:
screen -S ttyd
This will create our screen session that we’ve named ttyd and can be easily viewed with screen -ls.
Read-only ttyd sessions
The behaviour that we went from when a user connects to ttyd in their browser is to connect and view the one master share and have it read-only. We can accomplish this with using the screen -x <session> command and starting ttyd in read-only mode. The following command will start ttyd on a particular port, in read-only mode -R and when a client connects it will connect to the master screen session.
ttyd -R -p <port num> screen -x ttyd.
Keppler
Keppler is a fantastic tool for allowing people to remotely see code updates in a very friendly UI, along with browsing the differences as the code is modified. The github repository for keppler is https://github.com/brunosimon/keppler
To make life easier for myself, i’ve wrapped the usage of keppler in a docker container so I can just move to a directory where I want to expose what I’m working on and just run an alias keppler!
Fixes to file watchers
On Linux the below is required so that keppler wont panic when trying to monitor source code files changing.
1 2 3
echo fs.inotify.max_user_instances=524288 | sudo tee -a /etc/sysctl.conf && sudo sysctl -p echo fs.inotify.max_user_watches=524288 | sudo tee -a /etc/sysctl.conf && sudo sysctl -p echo fs.inotify.max_queued_events=524288 | sudo tee -a /etc/sysctl.conf && sudo sysctl -p
Keppler Dockerfile
Below is my Docker file that will create an image with everything needed to start keppler and expose it on port 1234.
1
2
3
4
5
FROM node RUN npm install -g keppler RUN mkdir /keppler WORKDIR /keppler CMD keppler "keppler" --port 1234
Build the dockerfile with the below command, which will create our image keppler:1.0.
docker build -t keppler:1.0 .
Keppler alias
The shell alias below will create automatically start the keppler container and expose the contents of the directory where it is started.
1
alias keppler="docker run --rm -d -v \`pwd\`:/keppler -p1234:1234 --name keppler keppler:1.0"
Stopping Keppler
As it is running as a docker container, it can be simply stopped with the command:
The current trend of application modernisation is somewhat of a misnomer, especially when we consider the typical end-results from the modernisation procedure:
Typical results:
Application code-unchanged
Operating environment (libraries and dependancies) largely unchanged
Application behaviour largely un-modified
Application network interactions typically un-modified
The actual result tends to be Application environment modernisation, where the application is re-platformed onto a modern platform but is still behaving in a “perhaps” un modern pattern. This does allow a number of benefits:
Finally getting an old application running in the same environment, but on a modern platform
Getting the application monitored by modern tooling
Adding the application into a consolidated platform, increased packing (utilisation)
The application can be monitored for health and behaviour and restarted
Application is now packaged as a container for ease of movement and re-deployment
The next questions is how do we identify an application that can be “modernised”, a lot depends on what remains of the application. With Source code, we can review it’s behaviour and perhaps make changes to make it more cloud-native. However without that, then we need to adopt an investigative route to work out what to do next.
Source code analysis
1 2 3 4 5 6 7 8 9 10 11 12 13 14 15
import "file.h"
func main() { int statePath; int byteCount; statePath = open("/state.dat"); read(fd); // Update // Write back result byteCount = write("", fd); //return successfully return 0; }
The above code-snippet is an small example of a program (written in C) that performs a few simple actions:
Attempt to open a file state.dat
Read the contents of this file (as an integer/number)
Increment this value
Write the result back to the file
We can start to infer a few things by reading through the source code:
Dependancies
Looking at the source code of any application from the perspective of what its dependencies are immediately can start to give clues as to its behaviour. The above example imports a header called file.h that immediately leads to a conclusion that this application may be reading/writing to an underlying filesystem. (note: reading from a filesystem is perfectly accepted behaviour for a stateless application)
Variable analysis
This type of analysis is completely dependent on the “hope” that the original developer chose to utilise variable names that were descriptive enough to be both human readable and parsable by some level of analysis tool. In most programming languages variables are defined using a protected keyword (or token) such as int or bool to define the type of variable and a name for this variable. With this knowledge we can scan through the source code to find variable definitions that can start to define some level of application behaviour.
Code analysis (behaviour and external function calls)
The previous two methods for starting to understand application behaviour can be very quick to infer how the application will behave at runtime, especially in even large source files the dependencies are typically only declared once (at the top of the source code) regardless of the number of lines of code. However to truly understand what the application behaviour entails, we will need to analyse what functions the code is making use of and how it is calling them.
If we consider the above snippet we can see that it is making use of a header that we know is used for file based operations, we can now start to analyse the code in more detail to determine what operations the application will be performing. A simple scan should reveal that there are three operations above that are attributed to file based behaviour open(), read() and write().
As mentioned above opening and reading files is perfect behaviour for a stateless application, think of a stateless web server that is only serving assets such as images. Every request will result in an open("/path/to/image") followed by a read() function to read the image data from the file so that it can be served to an end user.
However just by the naming of the function write() we can see infer a behaviour that will attempt to mutate the environment where this code is running and what it is interacting with. Luckily this naming of function call can be seen across functions in various languages, such as GO, python, nodejs and a number of others.. although in reading about other languages I came across a perl example (which i’ve not used in many years) which involves using the print command to a file handle. This exists in some of the prior examples but typically wouldn’t be the average behaviour.
No Source code, No Problem (perhaps)
Without source code, we still can determine the behaviour of a program and it’s a approach to immutability (and permissions) by doing the following:
Running in a read only environment and watching the behaviour
Running in a container, restarting and examining the resulting behaviour
Both scenarios in combination with a tool like strace to watch for what caused the failed behaviour
The first example will result in typically one of two scenarios.. the program will behave as expected taking input from somewhere, processing it in memory and sending the results somewhere else .. or .. reading the input, attempting to open a handle to where results will be stored and then .. error messages.
The second example .. has caught out, and will continue to catch people out since this paradigm began. A container environment is a brand new hire car, a brand new hotel room (built the same way every time you use it). If you left anything in the hire car/hotel room when you last used it .. well it’s gone (but the room was exactly the same, just it was a new copy).
This is the second post around developing Go code against the vSphere/vCenter APIs using govmomi, if you’re new to this then I would recommend you start with https://thebsdbox.co.uk/2019/07/04/First-steps-with-Govmomi to fully grasp the basic concepts.
Extending our example
The example that we built in the previous post was a very simplistic example that contained only the basic functionality to log into a vSphere/vCenter server, other than testing a users credentials it had no real functionality. In this post we will extend its functionality in order for it to actually interact with various objects and types that exist in both vSphere and vCenter.
Proposed functionality
The next version of our demo application will have the following functionality:
Retrieve objects
Select objects via type VM/Network/Storage
Implement RegEX filters to sort results
The credentials will be passed via environment variables, and the the search parameters will be passed in through CLI flags.
// Check that an address was actually entered if v.address == "" { return nil, fmt.Errorf("No VMware vCenter URL/Address has been submitted") }
// Check that the URL can be parsed u, err := url.Parse(v.address) if err != nil { return nil, fmt.Errorf("URL can't be parsed, ensure it is https://username:password/<address>/sdk") }
// Check if a username was entered if v.username == "" { // if no username does one exist as part of the url if u.User.Username() == "" { return nil, fmt.Errorf("No VMware vCenter Username has been submitted") } } else { // A username was submitted update the url u.User = url.User(v.username) }
if v.password == "" { _, set := u.User.Password() if set == false { return nil, fmt.Errorf("No VMware vCenter Password has been submitted") } } else { u.User = url.UserPassword(u.User.Username(), v.password) } return u, nil }
// Create a new finder that will discover the defaults and are looked for Networks/Datastores f := find.NewFinder(c.Client, true)
// Find one and only datacenter, not sure how VMware linked mode will work dc, err := f.DatacenterOrDefault(ctx, "") if err != nil { return fmt.Errorf("No Datacenter instance could be found inside of vCenter %v", err) }
// Make future calls local to this datacenter f.SetDatacenter(dc)
// Set the host that the VM will be created on i.hostSystem, err = f.HostSystemOrDefault(ctx, i.findHost) if err != nil { return fmt.Errorf("%v", err) }
// Find the resource pool attached to this host i.resourcePool, err = i.hostSystem.ResourcePool(ctx) if err != nil { return fmt.Errorf("Error locating default resource pool") }
i.network, err = f.NetworkOrDefault(ctx, i.findNetwork) if err != nil { return fmt.Errorf("Network could not be found") }
// Create a new finder that will discover the defaults and are looked for Networks/Datastores f := find.NewFinder(c.Client, true)
// Find one and only datacenter, not sure how VMware linked mode will work dc, err := f.DatacenterOrDefault(ctx, "") if err != nil { return nil, fmt.Errorf("No Datacenter instance could be found inside of vCenter %v", err) }
// Make future calls local to this datacenter f.SetDatacenter(dc)
vms, err := f.VirtualMachineList(ctx, "*")
if sortVMs == true { // Sort function to sort by name sort.Slice(vms, func(i, j int) bool { switch strings.Compare(vms[i].Name(), vms[j].Name()) { case -1: return true case 1: return false } return vms[i].Name() > vms[j].Name() }) }
return vms, nil }
1 2 3 4 5 6 7 8 9 10 11 12 13 14 15 16 17 18 19
func searchVMS(searchString string, v []*object.VirtualMachine) ([]*object.VirtualMachine, error) {
var newVMList []*object.VirtualMachine var err error for x := range v { matched, err := regexp.MatchString(searchString, v[x].Name()) if err != nil { break } // If the regex matches then add it to the new subset if matched == true { newVMList = append(newVMList, v[x]) } } if err == nil { return newVMList, nil } return nil, err }
This guide will assume that there is at least the basic familiarity to install the GO (golang) compiler tools, anyone looking for a start will find pretty much everything they need here -> https://golang.org/doc/install
What is Govmomi
The VMware virtual machine products (vSphere/ vCenter) expose the functionality through an API that is documented here -> (https://www.vmware.com/support/pubs/sdk_pubs.html). The technology that these APIs are exposed through is called SOAP (https://en.wikipedia.org/wiki/SOAP) and can be a little bit of a headache to interact with directly. However to ease the lives of anyone wanting to develop code against this SOAP api, VMware have released SDKs and libraries in a variety of languages (python, Java, .Net etc..). The Govmomi library is a GO package that provides the majority of functionality that an end user needs in order to communicate with the VMware vSphere/vCenter APIs.
Getting govmomi
All of the required source code for the VMware vSphere/vCenter GO SDK can be found on github at the following url -> (https://github.com/vmware/govmomi) as mentioned on the README has the go command for pulling the govmomi package.
go get -u github.com/vmware/govmomi
Note: The -u flag instructs go to pull any named dependencies.
To ensure that the govmomi packages were downloaded correctly we should be able to see all the code source tree by running the following command:
ls -la $(go env GOPATH)/src/github.com/vmware/govmomi
Hello World
Just to check that our environment is working as expected lets quickly create the hello world example to just to verify your GO environment. The following code snipped will create a file called govmomi/example.go which we can then use to ensure that things are working as expected.
The following commands can be copy and pasted into a terminal and will create a local govmomi directory and create the example.go file that we will use for development moving forward.
Hello World source code
1 2 3 4 5 6 7 8 9 10
mkdir govmomi; cd govmomi cat <<EOF > example.go package main
import "fmt"
func main() { fmt.Println("Hello world") } EOF
To run the above code we can use the following command go run example.go, and we should see Hello world printed to STDOUT.
Logging into VMware vSphere or vCenter
The following code snippet will extend on our previous example, and will make use of additional packages including the govmomi package to provide our required functionality.
Note: This code uses the url of the vSphere/vCenter instance were trying to interact with. This url will always require the following formatting:
c, err := govmomi.NewClient(ctx, u, true) if err != nil { fmt.Printf("Logging in error: %s\n", err.Error()) return }
fmt.Println("Log in successful") c.Logout(ctx) }
To understand this code we will deconstruct the various important sections.
Imports
To provide the required functionality were pulling in a lot more packages, for a bit more understanding I’ve added either the project URL or the godoc location.
There are a number of different methods a developer could use to pass data into a program, it could even be hardcoded into the code itself (not recommended). The main options for getting data into a simple CLI program are:
Read the data from a file
Pass data from environment variables
Pass data to the program at runtime through command line flags
In our example we will be using flags thats are provided through the standard library and work in a key/value fashion. The key being the name of the flag -url and the value being data we pass to this key https://{...}.
The following two lines taken from the code above will handle the user input from the CLI.
This first line will declare a variable vURL that will be assigned from the flag named url. vURL := flag.String("url", "", "The URL of a vCenter server")
The second line will parse all of the created flags to ensure that they’re read correctly or assigned their default values etc.. flag.Parse()
URL Parsing
The govmomi client requires a URL object not just a string representation of the vCenter URL. So we will use the net/url library to parse the string taken from the flag -url as done with the line u, err := url.Parse(*vURL)
Context
The two lines around context (explained above) are used to ensure that a state is shared across multiple APIs, functions and goroutines. In our simple example we don’t need to delve into this in two much detail, but if were to imaging that there were multiple operations taking place such as processing some data, logging into vCenter etc.. and one of the operations failed for a reason, the context would be used to share the fact that all of the other operations sharing that context needs cancelling.
Creating a vCenter/vSphere client
At this point in the code we’ve taken the VMware vCenter URL from a CLI flag and we’ve set up a context to handle a shared state, we will now use these in order to create our vCenter client with the line c, err := govmomi.NewClient(ctx, u, true).
Quickly deconstructing this line:
c, err - Return the client object c and an error object err (more or err in a second)
govmomi.NewClient - Call the function from the govmomi package
ctx - Pass in the shared context
u - Pass in the “parsed” url (ultimately taken from the -url string)
true - A Boolean value true/false that dictates if the client will tolerate an insecure certificate (self-signed)
If the function call doesn’t return an error object then the login was successful so we print a message to STDOUT and call the logout method on the govmomi client object.
Error handling
A lot of functions in GO will typically return more than one variable/object and the majority of them will return an object of type error, we can see this by looking at the returns from the url.Parse() and govmomi.NewClient() function calls. In the event of a function being successful then the function will return nil in the place of an error object. However when things go wrong then a function should create a new error object with the appropriate error details/messaging.
To check if a function has failed the boiler plate code would typically look like:
To run our code is very simple, we have two options we can compile it directly into a binary or run it directly from the source
Build a binary
We will build our code into a program called govmomi with the command go build -o govmomi we can now run our code with the command:
1
2
3
go build -o govmomi ./govmomi -url "https://dan@vsphere.local:CorrectPass@vcenter.devlab.local/sdk" Log in successful
Run from source
To run directly from the source code we use the go run command as shown below:
1 2
go run example.go -url "https://dan@vsphere.local:CorrectPass@vcenter.devlab.local/sdk" Log in successful
Next Steps
If everything worked as expected then there should be a success message printed on screen, in the next post we will look at extending our very basic example into something that offers a lot more functionality.
BONUS POINTS
In this example we pass in the URL through the use of flags on the CLI, another user on the same host will be able to find the vCenter URL and credentials by looking at teh list of processes. The use of environment variables will keep that hidden and within a users session.
Think about removing the flag.String and look at os.Genenv :-)
There was a great post recently from Dieter Reuter around building the smallest possible Docker Image, which I thought posed an interesting idea mainly due to some of the crazy sizes of Docker images I keep having to deal with. I decided that I would join in with the challenge and see where I could shrink both a binary and by association the resulting Docker Container down to it’s smallest possibility.
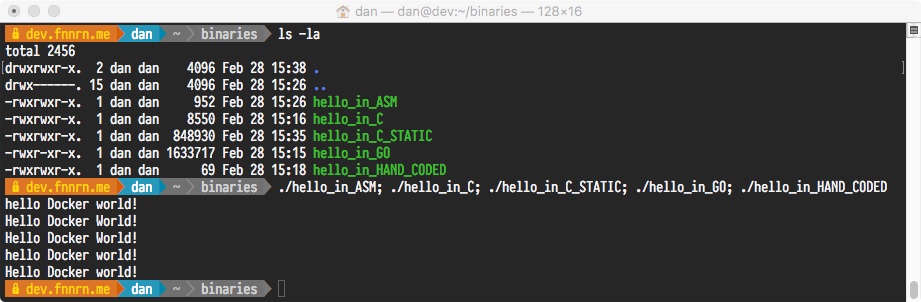
I created a number of binaries during my playing around, below is a list of five of them that all print to STDOUT the following text “Hello Docker World!\n” If you’re not familiar with escaped characters, the \n simply is the newline character.
*I realise I capitalised some of the strings by accident, but ‘h’ still occupies the same space as ‘H’ 😉
Initial failure
Before I delve into the steps I went through to make the small container, it’s worth pointing out that there is a fatal flaw in one of the above binaries when placed in a SCRATCH container. hint there is a duplicate binary with the suffix _STATIC 🙂
The reason that the hello_in_C will fail to run in the SCRATCH container is that it has dynamic requirements on a number of system libraries. Most notably is libc, which is the base C library that contains a lot of basic day-to-day code that provides the standard functionality to C programs. If we were to place this into a Docker container the following would be the result:
1 2
$ docker run -it --rm hello:C standard_init_linux.go:178: exec user process caused “no such file or directory”
We can examine binaries to check for external dependencies using the ldd tool to see what external libraries are needed to run the binary file. Alternatively, we can use volume mapping to pass the host Operating System libraries into the SCRATCH container -v /lib64:/lib64:ro, this will provide the libraries required for this particular executable to successfully execute.
1 2
docker run -v /lib64:/lib64:ro -it --rm hello:C Hello Docker World!
To permanently fix this issue is quite simple and requires building the C binary with the -static compile-time flag (the package glibc-static will be required), this quite simply will bundle all code into a single file instead of relying on external libraries. This has to knock on effect of making the binary easier to run on other systems (as all code is in one place) however the binary has now increased in size by 100 times… which is the opposite of what we’re trying to accomplish.
What makes an Executable
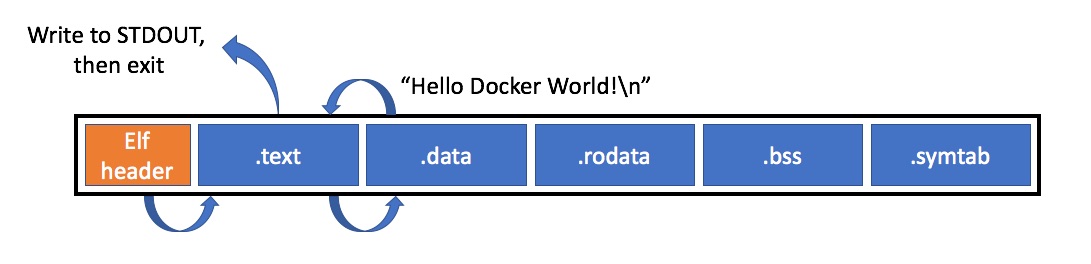
Ignoring MS-DOS.com files that no-one has touched and hasn’t been supported in years, most executables regardless of Operating System typically consist of a header that identifies the executable type (e.g. elf64, winPE) and a number of sections:
.text, code that can be executed
.data, static variables
.rodata, static constants
.strtab / .shstrtab, string tables
.symtab, symbol tables.
The Executable header will contain an entry that points to the beginning of the .text section, which the Operating System will then use when the executable is started to find the actual code to run. This code then will access the various bits of data that it needs from the .data or .rodata sections.
Basic overview of a “Hello Docker World!” execution process
The exec() family functions will take the path of file and attempt to have the OS execute it.
The Operating System will examine the header to verify the file, if OK it will examine the header structure an find the entry point.
Once the entry point is found, the operating system will start executing the code from that point. It is at this point where the program itself is now running.
The program will set up for the function to write the string to stdout
Set string length
Set the pointer to the string in the .data section
Call the kernel
Call the exit function (otherwise the kernel will assume the execution failed)
Strip out Sections
In the quick above diagram, we can see through the course of execution that there is a number of sections within the executable that aren’t needed. In most executables there may be debug symbols or various sections that apply to compilers and linkers that are no longer required once the executable has been put together.
In order to have a stripped executable, it can either be compiled with the -s flag (also make sure -g isn’t used, as this adds debug sections). Alternatively we can use the strip tool that has the capability to remove all non-essential sections.
1 2 3 4
$ strip --strip-all ./hello_in_C_STRIPPED $ ls -la hello_in_C_ST* -rwxrwxr-x. 1 dan dan 848930 Feb 28 15:35 hello_in_C_STATIC -rwxrwxr-x. 1 dan dan 770312 Feb 28 18:07 hello_in_C_STRIPPED
With languages such as GO, there can be significant savings by stripping any sections that aren’t essential (although if you’re doing this for production binaries it should be part of your compile/make process).
Extreme Shrinking
The final option that will keep your hands clean for shrinking an executable is to make use of tools like UPX which adds a layer of compression to your executable shrinking what’s left of your stripped binary. Taking my original GO binary I went from:
go build hello_docker_world.go = 1633717 bytes
strip --strip-all = 1020296 bytes
upx = 377136 bytes
Clearly a significant saving in terms of space.
Getting your hands dirty
Everything that has been discussed so far has been compiled through standard build tools and modified with the compiler or OS toolchain that managed executables. Unfortunately we’ve reached as far as we can go with these tools, as they will always build to the ELF/OS standards and always create the sections that they deem required.
In order to build a smaller binary, we’re going to have to move away from the tools that make building executables easier and hand craft a tailored executable. Instead of sticking with the format of [header][code][data], we’re going to look at how we can hide our code inside the header.
Whilst there are some parts of the header that are a requirement, there are some that have to just be a non-zero value and others that are left blank for future use. This is going to allow us to simply change entries in the ELF header from legal values to the code we want to execute and the following will happen:
The Operating System will be asked to execute the file
The OS will read the ELF header, and verify it (even though some values don’t make sense)
It will then find the code entry point in the header that points to the middle of the actual header 🙂
The OS will then start executing from that point in the header, and run our code.
Explained Code below
This code pretty much fits just in the ELF header itself, so I have broken the header up and labelled the header fields and where we’ve hidden the code we want to execute.
First part of header (has to be correct)
Op Code
Explanation
org 0x05000000
Set Origin address
db 0x7F, “ELF”
Identify as ELF binary
dd 1
32-bit
dd 0
Little endiann
dd $$
Pointer to the beginning of the header
dw 2
Code is executable
dw 3
Instruction set (x86)
dd 0x0500001B
dd 0x0500001B
Entry point for our code (section below)
dd 4
Broken Header / Our code
Op Code
Explanation
Further details
mov dl, 20
Address of Sections header
Take 20 characters
mov ecx, msg
From the string at this address
int 0x80
Elf Flag table
Print them
Remaining header (has to be correct)
Op Code
Explanation
db 0x25
Size of the Elf Header
dw 0x20
Size of the Program Header
dw 0x01
Entries in the Program Header
Remaining Code (now beyond the header)
Op Code
Explanation
inc eax
Set Exit function
int 0x80
Call it.
String section
msg db ‘Hello Docker world!’, 10
It’s also worth pointing out that this code won’t be fully “compiled”, as what is written above is actually binary format and therefore nasm will take the text and write out the binary code directly as written above.
In order to get a deeper understanding into the design and logic of a Kubernetes controller, we will start by deconstructing the example that comes with the Kubernetes source code. We will examine the structure of the source code, the code generation that automates a lot of the boiler plate and then the actual controller (controller.go) code that manages the logic.
Use-case of sample-controller
A Kubernetes controller is designed to take the functionality that the kubernetes scheduler has and apply its mechanisms to additional use-cases. The “original” controller was an etcd controller which allowed kubernetes to become aware of etcd and its mechanisms so that kubernetes could suddenly create/scale/upgrade and destroy etcd clusters correctly.
The sample-controller is a simplistic controller that creates a resource called Foo that defines a number of additional resources and constraints.
Core components of a controller
A controller can leverage a number features of the client-go library in order to efficiently interact with the Kubernetes API, this section will cover a few of the concepts exposed from the client library that are used by the sample-controller
Informer
Without the concept of the informer a controller would have to repeatedly “poll” the Kubernetes API for state information, this can be an anti-pattern that can cause additional load on the Kubernetes API and create controller overhead as it processes additional reply data from a poll. In order to provide an efficient method of determining the state of a resource in Kubernetes the client-go library has the concept of an informer. The informer allows a client to specify a particular resource and the operations to be “informed” about.
Create an informer
This will set up the informer, and then start with a channel to can signify when it needs to shut down.
A lister provides the capability to retrieve various objects (types) from the Kubernetes API, and is part of the informer that we created previously however instead of creating various callback functions the client invokes a “list” as part of a query. The Lister query typically will be invoked with two parameters, the namespace that the resource resides in and the name of the resource of a particular resource type.
1
2
3
4
5
deployment, err := c.deploymentsLister.Deployments(foo.Namespace).Get(deploymentName)
// If the resource doesn't exist, we'll create it
if errors.IsNotFound(err) {
	deployment, err = c.kubeclientset.AppsV1().Deployments(foo.Namespace).Create(newDeployment(foo))
}
Getting the source code
There are two components that will be needed in order to build our Kubernetes controllers, one being the code generation tooling and the second being the actual code that makes up the sample controller.
Kubernetes Code Generation tools
go get -u k8s.io/code-generator/...
Note Why the ...
From the command go help packages:
An import path is a pattern if it includes one or more “…” wildcards, each of which can match any string, including the empty string and strings containing slashes. Such a pattern expands to all package directories found in the GOPATH trees with names matching the patterns. As a special case, x/… matches x as well as x’s subdirectories. For example, net/… expands to net and packages in its subdirectories.
Kubernetes Sample Controller
go get k8s.io/sample-controller
How the source code is organised
There are a few areas that are key to how the structure of this all makes sense, in order to understand this we will walk the directory structure and identify some of the key files. To begin we should be in the directory with the sample-controller source code is located (should be $GOPATH/go/src/k8s.io/sample-controller).
The two main functions that are invoked are syncHandler() and handleObject.
The syncHandler with be invoked with a namespace and object name that is taken from the work queue, it will then attempt to find the object in the Kubernetes API and process it.
Split the key into a namespace/object name
Use a Lister to find the object in the API server
Parse the object and look for it’s deployment
Use a Lister to find the deployment object referred to in the Foo resource
If the deployment doesn’t exist create it
If the Foo resource has changed update the deployment
The handleObject is invoked through the informer and will add things to the work queue that will be processed eventually by the syncHandler function.
pkg/apis/samplecontroller
In this folder are a number of files that identify the controller name, the controller version and then all of the information that the controller needs in order to define itself or interact with other systems. All of these files are then processed by the code-generator tools in order to build out the correct source to work as expected with Kubernetes.
Test the code generation
The sample-controller repository comes with pre-generated code already in the packages folder. We can teat the code generation tools by moving the generated code to a different location and re-generating out code.
The following will move the generated folder to a backup folder:
mv pkg/apis/generated pkg/apis/generated-backup
The update-codegen.sh script is a hardcoded script that will regenerate all the code for the sample controller.
./hack/update-codegen.sh
Test that our code compiles correctly from out generated code.
go build
Custom Resource Definition (CRD)
This will update the Kubernetes API to inform it that a new resource of type Foo exists and is controlled by the controller samplecontroller.k8s.io version v1aplpha1.
I’ve been running an iPad Pro as a travel device for about six months now and I though I would make a quick post that details some of the ways i’ve added it into my workflow and a few of the apps that I use on a daily basis.
Hardware
I’ve had a few iPads over the years ranging from the first iPad in 2010 and an iPad mini 2 that has served as my travel entertainment device for a long time. After toying with the idea for some time I decided to opt for the 11 inch iPad Pro (https://www.apple.com/uk/ipad-pro/) as a replacement for my old and tired iPad mini, but also perhaps something that could serve as an in-between when I was in confined spaces (planes/trains) or didn’t have my laptop.
The iPad as a piece of hardware is pretty incredible and with the removal of the home button has oodles of screen real-estate. The Face ID functionality has been flawless for unlocking and payments, however the camera is in a bit of annoying place when using the iPad in landscape mode. The number of times, i’ve held my iPad by the side and accidentally obscured the camera I can’t count.
The battery life has been pretty stable and with moderate usage and 4G the iPad will quite happily last the entire day with plenty of battery to spare. Additionally with the inclusion of USB-C I can charge the iPad with the same charger as my MacBook Pro in a very short period of time. One additional feature that has been very useful is the ability to use a USB-C to lightening cable and have the iPad charge my iPhone whilst on the move.
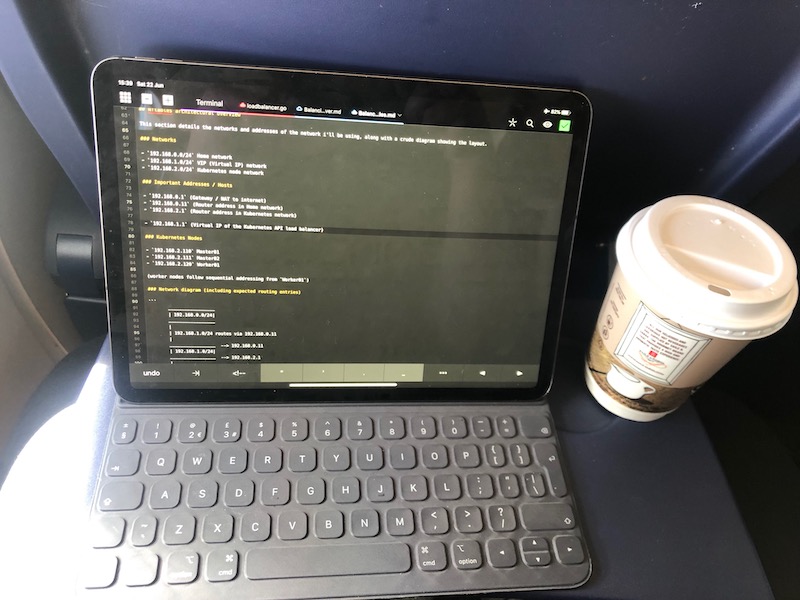
Finally, the Smart Keyboard Folio works as a fantastic keyboard for a good few hours of typing and makes using the iPad a lot more like using a laptop (along with expected keyboard shortcuts e.g. command-Tab). The one complaint with the Smary Keyboard is that it only protects the front and the back, however three sides of the iPad have no protection so it’s quite easy to aquire scratches and marks.
The small form factor means that the iPad can be used quite comfortably even on the most budget of “budget flights”, the image above is from a Ryan air flight where I happily could edit various files.
Productivity
My day to day technology stack is pretty average for most enterprise companies and luckily there exists pretty good replica iOS applications for the iPad:
Office 365 apps (Outlook)
Slack
Google drive app / Google docs
Trello
All of these are “good enough” for medium-to-light usage when a laptop and the “full fat” application isn’t present.
Remote Access
My typical day-to-day tasks usually require the management and usage of a variety of remote systems, there are a few native utilities on the iPad that really make this easy. Two of the best applications for this are by the same developer (https://panic.com/) and it really shows that they know what they’re doing when it comes to different types of remote workload.
Prompt
For handling SSH into various remote servers, I’ve found that Prompt is pretty much unbeatable for handling stable connections for various servers. It also provides a fantastic UI for managing multiple connection information for being able to re-connect to saved sessions upon restarting prompt.
Coda
Coda could perhaps replace Prompt as it does support SSHing into remote hosts, however its main focus is being able to access a remote host over SSH/SFTP to provide a great way of manipulating files on the remote filesystem through the Coda UI. I typically use if for editing both markdown files and various source code files, Coda provides the capability to provide source code highlighting based upon the file extension and more importantly (for markdown) a preview function that will render certain files. Once a file has been opened the first time within Coda it can be edited and saved locally (on the iPad and within the Coda app) and can then be saved back to the remote file system once connectivity is restored.
Visual Studio Code
I would love this to eventually become a native application on the iPad, however until then the only option is to access Visual Studio Code through a web browser using (https://github.com/cdr/code-server). Once code-server is up and running the iPad can access it through the safari web browser, however there are a few things that can make it a little easier to use:
Full screen
To access Visual Studo Code in full screen on the iPad it will need adding to the home screen. Open code-server in safari and press the button next to the address bar, then navigate to the “Add to Home Screen” button. This will now create a button on the iPad Home screen that will open code-server directly with things like the address bar hidden, providing Visual Code in full screen.
Disable Shortcut bad
When typing in Visual Studio Code iOS will keep popping up a bar with commonly used words and shortcuts that can limit the screen real-estate. To disable this open Settings -> General -> Keyboard -> Shortcuts (disable).
VNC Viewer
For accessing either my macbook or hackintosh VNC Viewer with the “Bonjour” capability makes it fantastically easy to find macOS desktops that are being shared through screen share. The VNC Viewer tool is perfectly designed for use with the touch screen with “pinch” and scroll and makes using a full desktop pretty straight forward.
Additional Usage
I presume that “Sidecar” will remove the need for an additional app (https://www.macrumors.com/2019/06/06/macos-catalina-sidecar-limited-to-newer-macs/) but currently the Duet application has been pretty great for turning the iPad into an external display for my Macbook. The performance is fantastic for the software having to handle all of the external monitor functionality, although it sometimes will take a few app restarts for the iPad to appear as a second display.